
Canadian Housing Market Stumbles in January 2026 Amid Severe Winter Storms
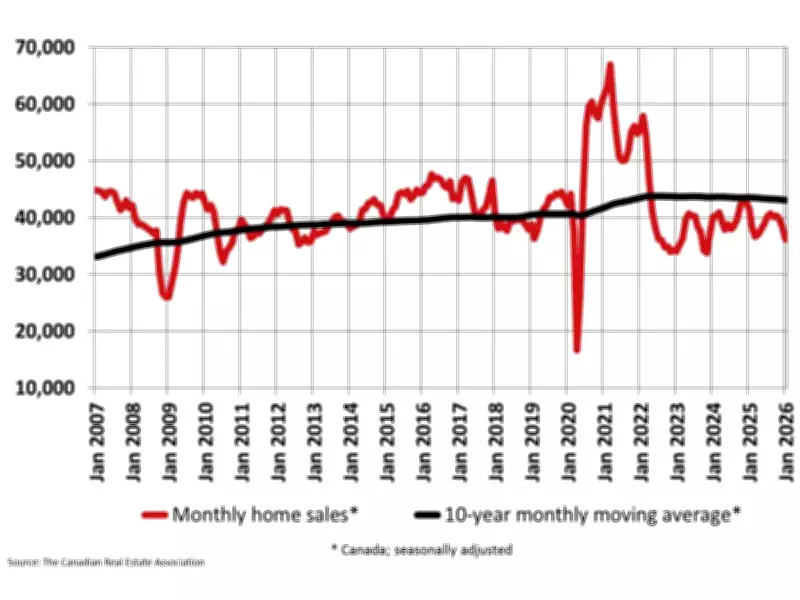
The Canadian housing market experienced a frigid start to 2026, with home sales declining significantly in January. According to data from the Canadian Real Estate Association (CREA), the number of transactions recorded over MLS® Systems across the country fell by 5.8% on a month-over-month basis.
Weather Disrupts Market Activity in Key Regions
Shaun Cathcart, CREA’s Senior Economist, attributed the monthly decline primarily to reduced activity in the Greater Golden Horseshoe and Southwestern Ontario. “The story was probably more about a historic winter storm than a downshift in demand,” Cathcart stated. He emphasized that despite this chilly beginning, 2026 is still expected to be shaped by pent-up demand from first-time buyers who are finally seeing opportunities to enter the market.
The actual, not seasonally adjusted, monthly activity came in 16.2% below January 2025 levels, highlighting the severity of the slowdown. Meanwhile, the number of newly listed properties jumped 7.3% month-over-month, indicating that sellers were eager to kick off the year.

Key Market Indicators for January 2026
The January housing data revealed several important trends:
- National home sales declined 5.8% month-over-month.
- The MLS® Home Price Index (HPI) fell 0.9% month-over-month and was down 4.9% year-over-year.
- The actual national average sale price dipped 2.6% compared to January 2025.
- New listings surged 7.3%, driven by markets including Montreal, Quebec City, Calgary, Greater Vancouver, and Victoria.
This pattern mirrored what occurred in January 2025, when new supply also increased significantly at the start of the year. However, Central and Southwestern Ontario were far less prominent in the new listing surge, with many areas recording declines instead.
Local Weather Impacts Market Dynamics
Valérie Paquin, CREA Chair, noted that local weather conditions can profoundly affect real estate markets. “We always say all real estate is local, and on occasion, including this January, that can mean the impact of local weather on the market,” Paquin explained. She added that while sellers appear eager to get started, it may take longer to see how buyers respond to the increased inventory.
The combination of rising new listings and slowing sales caused the national sales-to-new listings ratio to drop to 45% in January, down from 51.3% at the end of 2025. The long-term average for this ratio is 54.8%, with readings between 45% and 65% typically indicating balanced housing market conditions.
Inventory and Market Balance Metrics
At the end of January 2026, there were 140,680 properties listed for sale on all Canadian MLS® Systems. This represented a 4.5% increase from a year earlier but remained 11.4% below the long-term average for that time of year.
The months of inventory on a national basis rose to 4.9 months at the end of January, up from 4.6 months at the end of December. The long-term average for this measure is five months of inventory. Based on statistical norms, a seller’s market would be below 3.6 months, while a buyer’s market would be above 6.4 months.
The decline in the National Composite MLS® Home Price Index by 0.9% month-over-month reflects the increased supply and reduced demand observed in January. As the winter weather subsides, market participants will be watching closely to see if the anticipated pent-up demand materializes in the coming months.